
Science Topics
NEWS
194. Cardiac Sarcomere Coordination Switches One Link at a Time — Local Switching Is Linked to Variable-Reach Length Redistribution—
Researcher
Seine A. Shintani
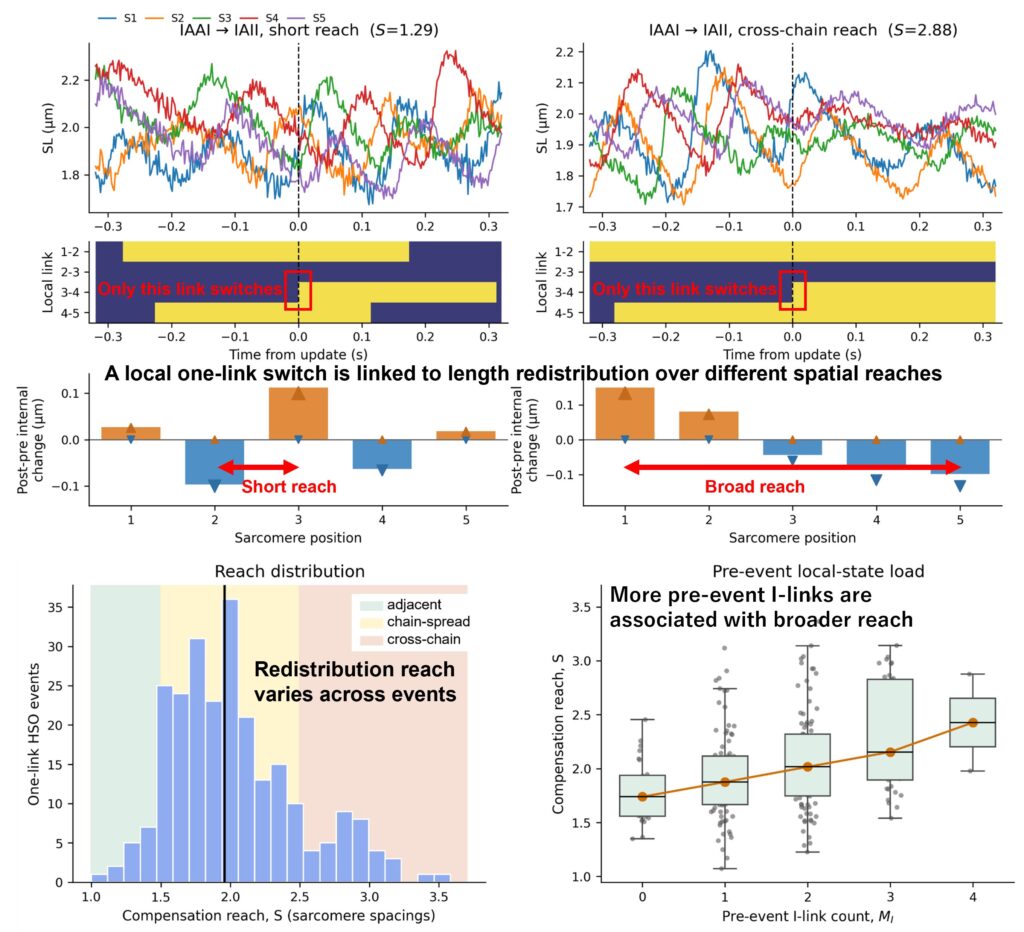
Although the heartbeat appears highly regular, it is still unclear how several sarcomeres connected in series coordinate their motion inside a living cardiomyocyte. Dr. Seine A. Shintani reanalyzed high-speed recordings of five consecutive sarcomeres in neonatal rat cardiomyocytes during hyperthermal sarcomeric oscillations (HSOs), a rapid self-sustained oscillatory state induced by local warming to approximately 41°C. The analysis showed that neighboring-sarcomere relations were updated mainly through “one-link switches,” in which only one of the four adjacent-pair relations changed while the other three were preserved. Importantly, even the same directed switch could be accompanied by different patterns of internal length redistribution: in some events, relative shortening and relative lengthening remained close to one another, whereas in other events they were separated across a wider part of the observed five-sarcomere chain. Moreover, the redistribution reach became broader when more neighboring pairs were in-phase before the switch. These findings identify a mesoscopic organizing process between stochastic actomyosin activity and robust whole-cell contraction. Rather than behaving as uniformly synchronized units, connected sarcomeres appear to maintain rhythmic motion by locally updating synchrony and flexibly redistributing length changes within the chain.
Seine A. Shintani. Structured neighboring-sarcomere switching is coupled to variable-reach internal length redistribution during hyperthermal sarcomeric oscillations in living cardiomyocytes. Biophysics and Physicobiology 23: e230024, 2026.
<Figure Legends>
The Same One-Link Switch Can Be Accompanied by Different Redistribution Reaches
The upper half shows two events with the same IAAI→IAII one-link switch across five consecutive sarcomeres. S1–S5 denote the five individual sarcomeres. In each example, the top plot shows sarcomere length, the middle plot shows the four neighboring-pair states (yellow, in-phase I; dark blue, anti-phase A), and the bottom plot shows relative length change across the five positions (orange, relative lengthening; blue, relative shortening). The vertical dashed line marks the switch, and the red box highlights the single link that changes from A to I. In the left example, shortening and lengthening remain close together, giving S=1.29. In the right example, they are separated across a wider part of the observed five-sarcomere chain, giving S=2.88. The red double-headed arrows are visual guides; compensation reach S is calculated from the full distributions of relative shortening and lengthening across all five positions. The lower-left panel shows the distribution of S across 248 one-link events for which S could be calculated; the black line marks the median, and the shaded bands indicate descriptive adjacent-, chain-spread-, and cross-chain ranges. The lower-right panel shows that more pre-event I-links are associated with larger S. Gray dots represent events, box plots summarize the distributions, and the orange line connects group medians.
Department of Biomedical Sciences, College of Life and Health Sciences, Chubu University